cholesterol

Extra Virgin Olive Oil vs. Butter Experiment v2.0

Update 11/16/2020: All of the results are going on the final experiment page

UPDATE 10/31/2020: First half of blood tests available! (see below)

My friend Dave Feldman had planned to do an experiment where he did a 4-week study of the effects of Extra Virgin Olive Oil (EVOO) and Butter, with all other sources of calories consumed remained constant. “Planned” because he ran into some problems and stopped. This is something I’ve done multiple times in the past so I decided to take over from Dave and run with it (besides, the guy can only do so many experiments a year). I’ll quote from Dave here:

One of the most common suggestions in lowering cholesterol (both total and LDL) is “replace saturated fat with mono and polyunsaturated fat”. This advice appears to have lots of evidence behind it. I’ve both read many studies and heard many stories that back up this advice, although individual results can vary.

In particular, I regularly hear one should “replace butter with extra virgin olive oil” where they can. Given the enormous popularity of both these sources of fat, I decided to set up an experiment to test each in isolation — and it’s going to be a bit ambitious.

Personally, I would much prefer to use Avocado Oil or Light Tasting Olive Oil, both have a light flavor that isn’t super terrible. Extra Virgin Olive Oil, on the other hand, tends to have a rather strong flavor that’s going to be a bit difficult to get through for 21 consecutive meals (twice). I suspect it’s going to be a bit like when I did Macadamia Nut Oil back in 2019, tolerable but no fun. As Dave said, it’s important that it be extra virgin olive oil because that’s kind of the “go-to” when people take out butter and other saturated fats from their diet, and the additional compounds that are in the extra virgin olive oil will likely come into play as well.

Experiment Design

The Experiment will be what’s called a “double crossover” – meaning that I will go back and forth TWICE modulating the variable (butter vs EVOO) each time. A “crossover experiment” is where the people doing the experiment do both phases, typically they do the placebo/control and the intervention. By doing this you can see if the effects of the changes are from a participant’s personal idiosyncrasies or if the change is really having an effect. By doing the crossover twice, it will allow control for a bunch of variables and will show if the effects of one fat are repeatable the second time, clarifying the effects. The only better way to do the experiment would be to wait a few months and repeat the experiment in the opposite order to further rule out the possibility of the order changing the results. I’m not going to do that, so don’t ask.

I will attempt to keep all other variables as equivalent as possible throughout: eating times, exercise times/duration, and sleep schedule. For the Extra Virgin Olive Oil (EVOO) I will be using Kirkland Signature Extra Virgin Italian Olive Oil. There is some VERY heated discussion about the authenticity and purity of Olive Oils, this particular product appears to be authentic and pure, it also is readily available for anyone else that is crazy enough to repeat this experiment. For the butter, I will be using standard plain Kirkland Salted Butter. I won’t be using “grass-fed” Kerigold or other fancy butter because the metabolic difference is negligible and I’m not buying into the narrative that beef and butter are only OK if they are “grass-fed” – if you want to have a discussion about the merits of “grass-fed” vs. conventional, please contact Dr. Peter Ballerstedt.

My daily diet during the experiment will consist entirely of:

  • 3 servings of Keto Chow – I’ll be using the plain Chocolate Flavor for all 84 meals during the experiment
  • 1 can per day of Kirkland Wild Alaskan Pink Salmon – this will add additional protein and give 1080mg of omega 3, plus something to chew =)
  • Water and Keto Chow Electrolyte Drops will be consumed ad libitum
  • 155ml of EVOO or 175g of Butter, during their respective phases of the experiment
Keto Chow for 4 weeks

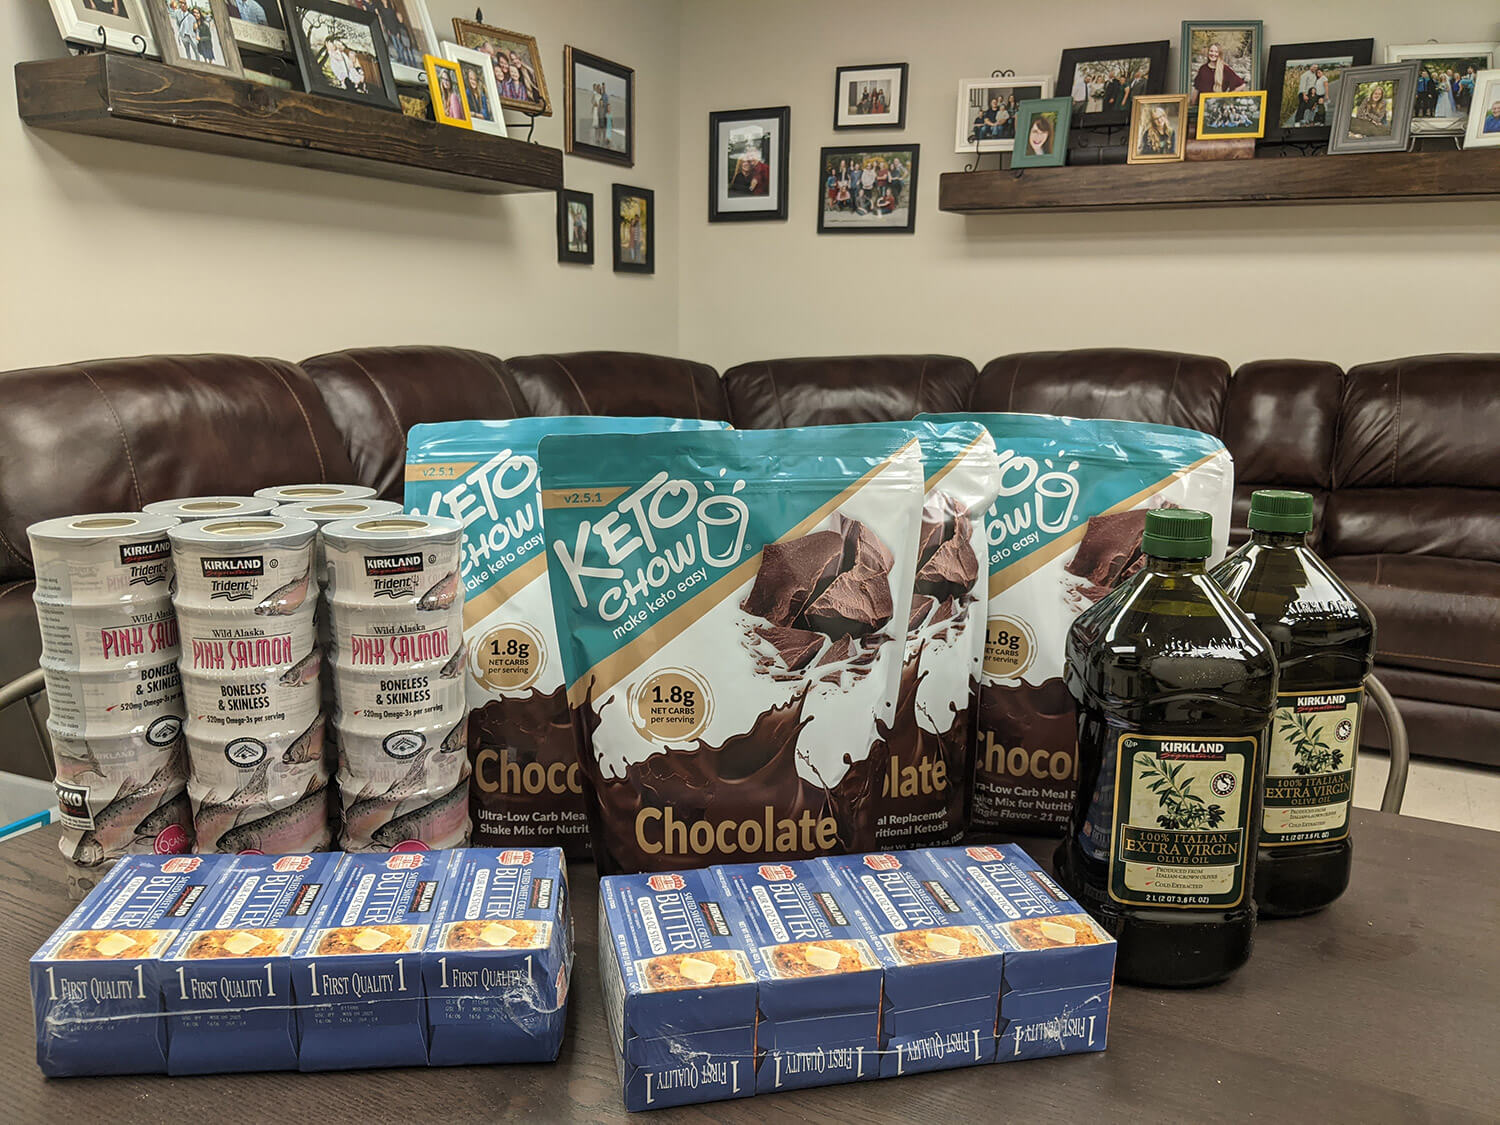
what I’m eating for 4 weeks!

Schedule Outline

  1. October 5: Baseline blood test.
  2. October 5-11 Extra Virgin Olive Oil
  3. October 12: Blood Test 2
  4. October 12-18 Butter
  5. October 19: Blood Test 3
  6. October 19-25 EVOO
  7. October 26: Blood Test 4
  8. October 26-November 1: Butter
  9. November 2: Blood Test 5

Blood and other tests

I plan to check blood ketones and glucose daily for the length of the experiment, I will also be collecting glucose readings using the FreeStyle Libre 2 system. Based on the design that Dave concocted, I expect I will be getting the same blood tests he planned:

  • Apolipoprotein A-1
  • Apolipoprotein B
  • C-Reactive Protein
  • Complete Blood Count (CBC)
  • Comprehensive Metabolic Panel (CMP)
  • Cortisol
  • Fatty Acids, Free (NEFA)
  • Ferritin, Serum
  • Fructosamine
  • GGT
  • Glucagon, Plasma
  • GlycA
  • Hemoglobin A1c
  • IGF-1
  • Insulin and C-Peptide
  • Leptin
  • Lipid Panel
  • Lipoprotein(a)
  • Lp-PLA2 Activity
  • Nuclear Magnetic Resonance (NMR)
  • Oxidized Low-density Lipoprotein (OxLDL)
  • Reverse T3
  • Testosterone, Serum
  • Thyroid Panel
  • Uric Acid, Serum
  • Vitamin B12 and Folate
  • Vitamin D, 25-Hydroxy

I’m also going to be going through the extra hassle to get some additional tests from Boston Heart Diagnostics as well. These include:

  • Adiponectin
  • Cholesterol Balance
  • Fatty Acid Balance
  • HDL Map
  • Interluekin-6
  • another Leptin
  • Oxidized Phospholipids on apoB (OxPL)
  • hs-CRP
  • another Comprehensive Metabolic Panel
  • Free T3
  • Free T4
  • Total T3
  • Total T4
  • Hepatic Function Panel
  • Renal Function Panel

Dave’s Endpoints of Interest

I’ll just go ahead and quote Dave for this:

As with the original design of this experiment I have outlined two categories of interest: lipid levels and inflammation markers. However, I’ll now be adding an additional test via Boston Heart that I’ve been waiting for — the Oxidized Phospholipids on apoB test (OxPL).

Something I’ve long speculated on is whether OxLDL would track tightly with OxPL. OxLDL is a pass/fail test — either the LDL particle has detectable levels of oxidation or it doesn’t. But the OxPL should show the degree of oxidation in those particles detected as an average for the total sampled. Thus, I think it will be an excellent test for risk and give us much more valuable information (but I do have some caveats, discussed below).

  • Will EVOO interventions have lower relative total and LDL cholesterol levels (TC & LDL-C)?
  • Will EVOO interventions have a greater oxidized LDL to total LDL particle count ratio (OxLDL/LDL-P)?
  • Will EVOO interventions have a greater oxidized phospholipid to oxidized LDL particle ratio (OxPL/OxLDL)

Discussion

Quoting Dave again:

As mentioned above, there are many factors that can influence cholesterol levels, particularly LDL. There is one effect that is rarely discussed in the literature but is of particular interest to me — how much we see particular types of dietary fat result in higher or lower oxidation per LDL particle.

In other words, are we seeing lower levels of LDL cholesterol because LDL particles are getting oxidized and cleared by scavenger receptors at a higher rate? There are many limitations to the experiment in how well it can provide evidence to this answer, but it might open the door.

We can’t easily know the true rate of clearance for OxLDL in vivo, or how much this is impacted by the degree of oxidation per particle. However, oxidized LDL particles are commonly understood to be cleared at a higher rate than unmodified LDL. So it will be meaningful data if we find a higher OxPL to OxLDL ratio in one intervention over the other.

Regardless, there will be quite a bit more data from all the other blood markers to provide comparisons that go well beyond lipids.

Results

The results are still coming in, but I have entered the first 2 tests (control and EVOO) from LabCorp and the first 3 tests (control, EVOO, and Butter) from Boston Heart into my running spreadsheet that contains ALL my blood test results from all the experiments I have done (you have to scroll pretty far over to the right, these new results are on AE).

By |2020-11-16T09:13:21-07:00September 25th, 2020|Categories: Keto Chow|Tags: , , , , , , , , , |2 Comments

Effects of Keto on blood work in identical twins

When we went to Low Carb USA (San Diego) earlier this summer, over a meal I mentioned to Dave Feldman that one of our sets of twins had one doing keto (hereafter referred to as “KT”) for a year and the other not doing keto (hereafter referred to as “NKT”). Dave got really excited (that’s a SEVERE understatement) and wanted to know if we could convince them to get some blood tests to see how keto was affecting their cholesterol, insulin, glucagon, and other factors. Dave wanted to make sure they had similar activity levels. Both have Fitbits Alta HRs, you can see the raw data from those here (KT) and here (NKT). They are relatively close in activity 169,928 steps for KT vs 158,278 for NKT over a 2 week period before the blood tests. Sleep patterns are noticeably different: the Fitbit on KT recorded 5524 minutes of sleep, the Fitbit on NKT recorded 6388 for the same 2 week period; that’s 92 vs 106.5 hours.

The same 2 weeks leading up to the blood draw, each was taking Dave Feldman style photos of everything they ate, which proved to be the biggest annoyance for both during the experiment and they were looking forward to concluding so they could stop with that. This was to ensure that we had a record of what they were eating and that both stayed pretty much consistent with their food during the 2 weeks before the blood draw. The day of the blood tests came, KT was worried as she has had issues with blood and fainting – strangely KT had absolutely no problems at all with the blood draw and was done in about 3 minutes. NKT, on the other hand, went pale and ended up needing to lie down before the lab could finish the blood draw. We were very happy that she came out OK, though I doubt she’ll be donating blood anytime soon. =)

Before we get to the results I should explain that both parents in our home are quite strict with keto for ourselves. Two of our daughters are also strict about staying keto, though both are more “lazy keto” and don’t track carbs or such – frankly, it’s not really necessary. As young and healthy as our children are, simply the act of cutting out sugar and flour was likely enough to prevent problems in the future. Our other children are not doing keto and will eat candy, pizza, fruit, and such if given the opportunity – though we, as parents, do not buy anything non-keto anymore so it’s usually at school or when visiting.

Now for the data! Dave wanted to get a recording of his first read-through of the blood tests:

Most of the analysis was done by Dave during the video so refer there for commentary. If you prefer to look at the data yourself, you can either read it in tabular format on the “Twins” tab of this spreadsheet (the other tabs are data from previous experiments I’ve done) which also has % difference and absolute value difference columns for comparison, or you can grab the original blood tests in PDF format: KT, NKT. I’ve made some handy graphs (also on that spreadsheet in the “Twin Charts” tab) to illustrate some of the takeaways.

To start, we have a comparison of their NMR Lipid Panels. Nothing here is really a surprise at all, KT has higher numbers for all of the measurements except LDL size which is the same for both, this follows Dave’s hypothesis regarding the lipid system as an energy distribution aparatus. Both are low on HDL but have fantastic Triglyceride levels. Both also have a remnant cholesterol of 8. Dave has explained this better but this number represents energy parked in the blood in VLDL particles and you want this as low as possible since it tends to be a legit indicator of risk; an 8 is fantastic.

Both have really good fasting glucose.

Which should make their nearly identical Hemoglobin A1c not a surprise at all. This number represents the percentage of their red blood cell hemoglobin that has become “glycated” or exposed to glucose. It serves as a way to measure your average glucose over several months, usually 6 months. HbA1c is the test used to diagnose Type 2 Diabetes Mellitus, although elevated HbA1c is a symptom of T2DM, not the cause. Most experts agree that the underlying cause is hyperinsulinemia or chronically elevated insulin levels.

Boom.

KT’s low fasting insulin doesn’t indicate how close she is to having hyperinsulinemia or her risk of T2DM or Alzheimers – that would require a Kraft test and measuring insulin response to glucose over time instead of once while fasting. NKT’s elevated fasting insulin does indicate that even without eating for 12 hours, her insulin was still elevated. For now, she’s likely to be able to handle that insulin load; but Dave feels that he’d like to see insulin below 10 in the future. This higher number for NKT was one of the few surprises that were in the test, most of the other markers fell in-line with what Dave expected to see based on the other results he has seen from both keto and non-keto subjects.

The other surprise was the low glucagon levels in both. A typical level is 50, and one would expect KT to have higher than normal levels. While hers is higher than NKT, both are abnormally low. Glucagon is something that Dr. Benjamin Bikman presented about at the 2018 Low Carb Breckenridge conference, interesting stuff.

So, in summary: It’s interesting to note the difference in the LDL numbers of the two. Many professionals are of the opinion that LDL is causal in atherosclerosis and would insist that KT has a higher risk of heart disease in the future. The cool thing with this data is that genetically they’re identical, with the same environment, same living conditions, same lack of cholesterol-lowering medication. They actually have almost the same triglyceride numbers too! NKT and KT both are handling the glucose load really well (that’s rather expected, given all the machinery is still new and fully functional). It is important to note the massive difference in their respective fasting insulin. So many of the chronic diseases in modern society are a direct result of too much insulin: chronic hyperinsulinemia. NKT is in danger of hyperinsulinemia causing problems in the future which is something to be truly concerned about.

By |2018-12-05T08:55:14-07:00November 23rd, 2018|Categories: Ketogenic Diet|Tags: , , , , , |0 Comments

Others using Keto Chow to conduct science!

Siobhan Huggins recently posted about her half of an experiment where she was tracking biomarkers while changing around the amount of fat she was using. We were super happy when she approached us about using Keto Chow for the experiment. I (Chris) have done my own experiments using Keto Chow to tightly control variables, which is difficult to do with nutrition unless you’re using something like Keto Chow – it’s cool to see others using Keto Chow for science as well.

Siobhan was going for 6000 calories a day during parts of the experiment. That’s a REALLY difficult thing to do unless you’re using something like Keto Chow:

I’d say, in this case, the inconvenience of having to drink 6 shakes a day was far outweighed by the data I got in the process. Lipoprotein(a) coming from a baseline diet to a high calorie/high fat phase provided some useful information that – of course – leaves me with even more questions, and possible future experiments in mind, for sure. Plus, it wasn’t too bad, as the very kind staff at the hotel where the conference was taking place offered to store my shakes in the front office fridge so they could stay refrigerated until I needed them. I’m extremely grateful, as this made the whole process much less of a hassle, and allowed it to go as smoothly as it did. The food served at the conference actually did look quite appetizing, but in this case the sacrifices of citizen science won out over the freshly carved meat they were serving.

Even with that said, I must say that my diet over the conference weekend was definitely more appetizing than what Dave was eating – as he expressed multiple times! I’m sure he’ll be mentioning that himself, however, in part 2

Sometimes science is hard =) You can read about the entire experiment and see all the cool graphs and data over on cholesterolcode.com.

By |2018-10-24T08:32:16-06:00October 24th, 2018|Categories: Keto Chow, Future Foods|Tags: , , , , , |0 Comments

Do Low Carb Diets Cause Early Death? (video)

This entry is part 122 of 131 in the series Ketogenic Diet

So there’s been a big to-do the last few days about a new study that purports to indicate that a low carb diet will cause an early death. The news headlines have been rather extreme, and it seems that everyone has forgotten the PURE study from 12 months ago. Regardless: our friend @kendberry.md Ken Berry, MD, put out a video discussing, at length, everything going on in this study.

From the description of the video:

Do low-carb diets really lead to early death? Here is my response to the recent article published in the Lancet Journal of Public Health. I’ve included links below because I want you to actually read the study and verify what I’m saying. This topic is so important, and this field of science is so dubitable, that you can’t take anyone’s word about it, you need to read it yourself.

Harvard University currently is highly esteemed in the fields of medicine and nutrition research. The Lancet is currently highly esteemed in the fields of medicine and nutrition publication. But, if they don’t both stop publishing rubbish such as this as valid science from which we can glean valuable information, the reputations of both will suffer soon. Main-stream media’s blind, thoughtless parroting of whatever Harvard and the Lancet say is actually crippling both institutions, and destroying their credibility.

Your one life and your health are too important to entrust blindly and thoughtlessly to “expert opinion” you need to read and watch and research for yourself, and listen to your own body.

By |2018-08-21T08:33:30-06:00August 21st, 2018|Categories: Ketogenic Diet|Tags: , , , , , |0 Comments

Chris on the FanPress podcast – the history of Keto Chow, nutrition, and more

This entry is part 115 of 131 in the series Ketogenic Diet

This podcast was recorded a while ago (January 28, 2018 to be specific), took Steve a while to get it posted – probably because it went kinda REALLY long. I have to say: this is by far one of my favorite podcast interviews so far. Steve let me (over) indulge myself and give a rather complete history of Keto Chow and my journey thus far. It was also nice to be talking to someone who really likes what I’m doing. I just checked my email and I have one from him way back from May 2015! This one will be tough to beat. It goes on rather long at nearly an hour and a half but if you’re up for it, I recommend checking it out!

http://fanpress.co/show3/

Keto Chow at the Low Carb Breckenridge 2018 Conference

This entry is part 111 of 131 in the series Ketogenic Diet

We returned yesterday from the Low Carb Breckenridge. It was really an awesome time. We met a lot of great people, hung out at the “cool kids” party house, ate some yummy fat (along with a little protein =) – I consider it a rousing success and I still haven’t even gone through the stack of annotated business cards to follow up with people yet! Photo Gallery:

https://photos.app.goo.gl/tvZBAtxJoqfjR8qH3

I had a chance to do a “5 Minutes of Fame” quick presentation about my most recent experiment – ended up at 2:47 which left extra time for Siobhan Huggins to go 6:57 =)

Results and conclusions from 6 week fat experiment (42 days of Keto Chow)

This entry is part 44 of 44 in the series 42 days of Keto Chow Experiment

I have my analysis done on the data from my 6-week experiment doing Keto Chow for all my meals and swapping out different types of fats to see how they impact my lipid panels. It’s all chronicled over on the page about the experiment, along with an extensive array of graphs and other fun stuff.

I also proved that at least in me: eating 2000 calories a day of mostly fat with some protein I’ll lose weight. Switch that to 2000 calories of mostly carbohydrates with a little fat and the same amount of protein (and again, the same 2000 calories), I will gain weight.

Fun stuff!

42 Days of Keto Chow – Day 41, blood tests back

This entry is part 41 of 44 in the series 42 days of Keto Chow Experiment

I was watching a video by Dave Feldman (where he had to keep pausing to eat skittles, it was great) and he talked about fructose malabsorption causing him digestive issues. I don’t think I have that problem which is why I haven’t had really bad problems during this phase. Again it seems that I dodged another bullet for which I’m grateful. I’m still anxious to get back into keto. Yesterday I bought the brisket and ribs for the meetup, they’re currently in the Sous-Vide cooking for a few days and I’ll finish them in the smoker on Saturday.

Got my Coconut Oil week blood tests back – REALLY interesting stuff. I’ve entered the data into the spreadsheet (check it out!) but here are some of the highlights:

  • I hit an all-time low LDL-P (particle count): 567. It’s down 43% from 996 the week before. ? (you’re looking for under 1000)
  • All time low LDL-C: 56, down from 78. ?
  • I brought back down my triglycerides from 148 to 103 ? (you want this below 100)
  • My HDL-C went WAY up (52% to be exact): from 40 to 61 ??? (you want this as high as possible)
  • A1c is still steady at 4.8 ?
  • Fasting insulin went WAY up, from 5.2 to 8.4 – the highest I’ve recorded so far. ?

This test was the first time I saw a departure from the previous inversion pattern of LDL-C and Triglycerides which would go up and down opposite of each other. I don’t know if it was the high amount of MCTs in the coconut oil or what. Regardless, I can handily say that consuming almost entirely saturated fat for a week made my blood tests look AMAZING.

Here are some of the graphs from the spreadsheet:

42 Days of Keto Chow – Day 20, off to S.F., Grape Seed Oil results

This entry is part 20 of 44 in the series 42 days of Keto Chow Experiment

I’m heading off to San Francisco in a few hours. Rather than worry about how to transport my shakes, I’m just going to do time-restricted feeding (“intermittent fasting”) by drinking all my meals this morning and afternoon, then I’ll eat again after I get home tomorrow. I had to bring everything I need with me to work, including an umbrella. Fun fact: I’ve been to San Francisco almost 10 times now, I’ve never been rained on (misted on, yes, but no rain) looking at the forecast, this might break that streak.

This morning I got back my blood tests from the week of doing Grape Seed Oil. Feel free to head over to the spreadsheet of results and check them out. Grapeseed oil is on Column O.

Let’s see… my LDL-P came way down (1242 to 849) – into the “normal” range thanks to the PUFAs, my LDL-C also came down (116 to 72) – again into the “normal” range. My triglycerides did indeed go up, though nowhere even close to the result I got with avocado oil in November: that one went from 113 to 199, this new test with grape seed oil went from 104 to 117. I guess we’ll see what happens with the subsequent tests with Saturated and MUFA: will the triglycerides go down or not?! While you’re on the spreadsheet, you can pop over to the other tabs and see the ongoing results coming in from the n=3 experiment that’s also going on. Both females have had really stable triglyceride levels, regardless of heavy cream or avocado oil. Makes me wonder if the 199 was a freak aberration (yes I was fasting at least 12 hours before the test).

So what else does the blood test show? On PUFAs my cortisol increased dramatically (9.8 to 12.7) and my fasting insulin predictably went down to 2.4. That’s actually the lowest I’ve ever gotten, 2.7 was the level when I did Avocado Oil. Oddly, my CRP (which along with cortisol is a marker for inflammation) was slightly up but still far lower compared to what I was getting in November.

42 Day of Keto Chow – Day 13: week 1 blood tests

This entry is part 13 of 44 in the series 42 days of Keto Chow Experiment

I got the first round of results back from the blood tests I did on January 12. For the most part, I’m not seeing anything particularly interesting but that’s mainly because these are the “baseline” ones to show what a week of eating only Keto Chow and heavy cream will look like. HDL is 52, LDL is 116, LDL-P (particle count) is 1242 (which is high). Glucose is normal and my fasting insulin is 4.4 which is quite good. You can see all the results of all my tests here.

My Hemoglobin A1c (which acts as a measure of the amount of glucose my red blood cells have been exposed to over their lifetime) has been steadily going down throughout my experiments. Glycated Hb A1c is the measurement typically used for the diagnosis of Diabetes Mellitus (not to be confused with “diabetes insipidus”). In the US it’s expressed as a percentage with numbers higher than 6.5 signifying diabetes, elsewhere it’s in mmol/l with values > 48 signifying diabetes. Typically you want lower numbers with <6% or <42 mmol/l. My first test in October 2017, my A1c was 5.1; In November 2017 it was at 4.9, and now in January it’s at 4.8. I wasn’t diabetic before I started doing keto, though I had a “deranged metabolism” that didn’t handle carbohydrates properly (you can tell because I was fat) and likely would have gone that direction in a few more years.

The 2 Keto Dudes do a better job of explaining what’s going on with diabetes but the interesting thing is that most doctors will prescribe enough insulin to keep blood sugar “low” but not in an ideal range. If you use insulin to bring down blood sugar and you go too far, you’ll actually end up in a coma. The problem is that (I’m working on memory here and a search didn’t find where it’s discussed at length) for each percent of HbA1c there’s an associated increase in all-cause mortality. Meaning if you use insulin to come down to a 7.0 – you are likely to die more than a person with a 6. Dang, I’m going to have to find the reference – it may be this but I’m not sure.

People with Type 2 diabetes make too much insulin and still have high blood sugar, those with Type 1 don’t make enough. The cool thing is: insulin is just a part of the regulation of blood sugar in your body and if that’s broken, guess what? there’s a backup! Your liver is able to synthesize all the glucose needed by your body. Provided you don’t introduce extra glucose into the equation, it’ll do a very good job regulating blood sugar all by its self. This is why people can go for month long fasts and not die without eating glucose.

By |2018-01-19T07:12:06-07:00January 17th, 2018|Categories: 42 days of Keto Chow Experiment|Tags: , , , |2 Comments